Dynamic Pricing implementation for Indianapolis Colts
Abstract
At its core, the dynamic pricing model is the concept of selling the same product at different prices to different groups of people. In order to implement the pricing strategy, we first looked at the two markets the NFL team sells their tickets: primary and secondary. Since the price control in the secondary market is not controlled by the NFL team, there is a substantial amount of lost revenue. Since the secondary market tends to change prices based on demand, Colts need to better price their tickets to mitigate the revenue loss. By constantly analyzing multiple demand factors and the secondary market prices, I built a model using GLM (Generalized Linear Model) that could predict the demand of the game and effectively price in the tickets to maximize the revenues.
Benefits of implementing dynamic pricing strategy
-
Greater control on pricing strategy
-
Allows flexibility without compromising brand value
-
Saves money in the long run
-
Can be managed effectively with the right tools
Price allocation is important since an error within the system can directly contribute to lost revenue. Traditional methods never really achieve the ideal pricing because of a heavy inclusion in manual labor (e.g., brick and mortar stores). Dynamic pricing algorithms, on the other hand, can use real time feedback data to make pricing decisions and increase the overall quality of the pricing models. For example, Amazon has adopted dynamic pricing on its platform where it updates the prices every 10 minutes

Methodology
The primary focus in our study is to recommend a pricing model that can preserve the lost revenue occurring through the secondary market. Therefore, once we understand the demand of a certain game, we can precisely predict the ticket price. Once we can predict the recommended price point, we can then analyze the differences between the NFL team’s current pricing strategy and our prediction model to determine the benefits of a dynamic pricing model.
Our analysis includes two steps:
-
Predictive model: Predict the ticket prices based on demand of the tickets. Some of the features that influences the demand are time of purchase, section name, season and road attendance.
-
Revenue maximization model: Once we find the optimal pricing strategy, we can then calculate the additional revenue generated by the team.

Data Pre-processing and Cleaning
-
First, we fixed all the formatting and organization issues within the data sets
-
For our current analysis purposes, we filtered out activity_name by TE Resale so we only get the rows that are successfully sold.
-
To connect the primary data set, we combined the event_name from secondary data set to event_code from the primary data set. From the primary data set, we only needed Event Description.
-
Since the EventDesc column is not consistent in formatting, we had to group certain aspects such as “Broncos vs. Falcons” and “Atlanta Falcons vs. Broncos”. Once we cleaned the column, we split the column by “vs.” so we can have a column that represents just the opposing team.
-
Lastly, we combined the “visiting team” column from “opp” data set to the opponent column that was split from the “EventDesc” column.
-
We also, subtracted the "add_daytime” from the “event_date” to give us the time left between the purchase date and the event date
-
We, then, one hot encoded a few features including “visiting team”, “section_name”, and “row_name” columns to give us quantifiable data specific to each team.
-
We deleted some columns that were repetitive such as “opponent” and “team”
-
To standardize the purchase price, we divided the price by number of seats to give us price per ticket.
-
These changes and cleaning resulted in our final workable data set which includes primary and secondary data along with opponent statistics.
EDA
-
Based on the volatility of revenue for the teams, we could assume that a specific team influences revenues and demand. Based on the “Number of Events” graph, we can see that the game against the Giants is higher in term of number of games and revenue.

-
The data for Facebook fans seem to be varied which suggests that it could have a decent impact on the ticket prices.

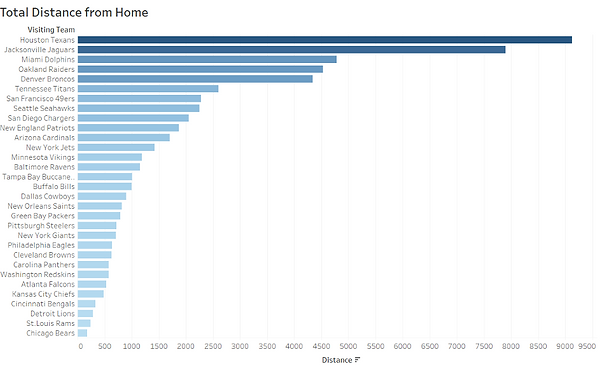
-
When looking at the Total distance, we can see that there seems to be a correlation with Revenue. The lower the distance to the team Home game, the higher the revenues seem to be for that team.
Predictive Modeling
After achieving the final cleaned data set, we split the data into train and test, with 70% being in the train data set while 30% being in the test data set. We trained and compared several predictive models through H2O regression model and ended up with GLM (Generalized Linear Model) as the optimal model.
Generalized linear model (GLM) is a flexible generalization of ordinary linear regression that allows for response variables that have error distribution models other than a normal distribution (Nelder and Wedderburn (1972)). GLMs are fit to data by the method of maximum likelihood, providing not only estimates of the regression coefficients but also estimated asymptotic standard errors of the coefficients. The GLM generalizes linear regression by allowing the linear model to be related to the response variable allowing the magnitude of the variance of each measurement to be a function of its predicted value.
RESULTS
Our optimal model predicted values for the ticket prices with an accuracy of 88.9%. We found that section name, season year, road attendance, date difference and last visit years to be the most influential features in determining the ticket prices.
In addition to the model performance, we can interpret the following:
-
Based on the historical data of the secondary market, the model recommends, on average, 27% increase in ticket prices.
-
An increase in ticket prices suggests and increase in top line revenue for the NFL team. There are instances when a few tickets should have been priced higher and the a few others should have been priced lower to maximize revenue.

CONCLUSION
In this study, the main objective is to implement dynamic pricing for the NFL team’s ticket prices in order to recover some of the lost revenue due to the secondary market. Based on the results, we can assume that implementing a dynamic pricing strategy will increase, on average, price per ticket by 27%. The data shows that if we utilized the trends of secondary market into the primary market, NFL team can increase its top line revenue significantly. We also noticed a few significant features that influenced the prices in secondary market such as section and date difference and therefore, it is wise to focus on these features to perfect the dynamic pricing models.